Market Report for Indio, CA 92201, dated 5/20/2025, covering single-family homes.

Indio Market Report: Weekly Update for May 20, 2025

Indio, CA 92201

Tue May 20 2025
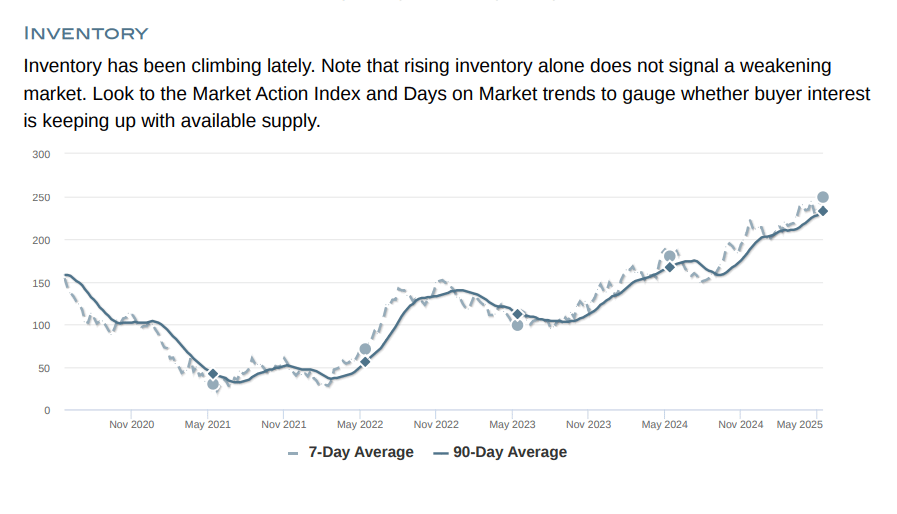
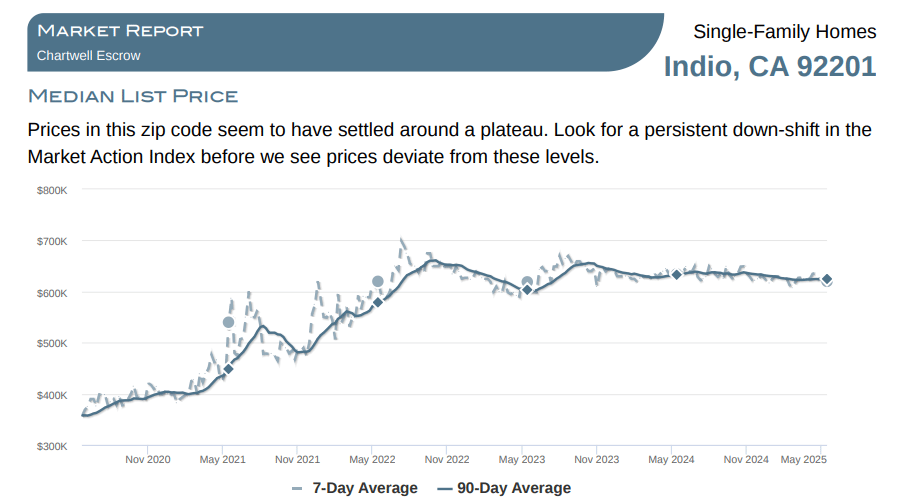
This week the median list price for Indio, CA 92201 is $620,000 with the market action index hovering around 31. This is about the same as last month's market action index of 31. Inventory has increased to 249. Click here to stay informed with the Indio market!

Market Action Index

This answers “How’s the Market?” by comparing rate of sales versus inventory.
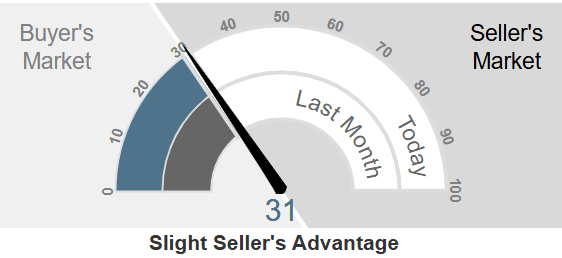
Market gauge at 31, indicating a slight seller's advantage; inner arcs compare last month and today.


Market Narrative

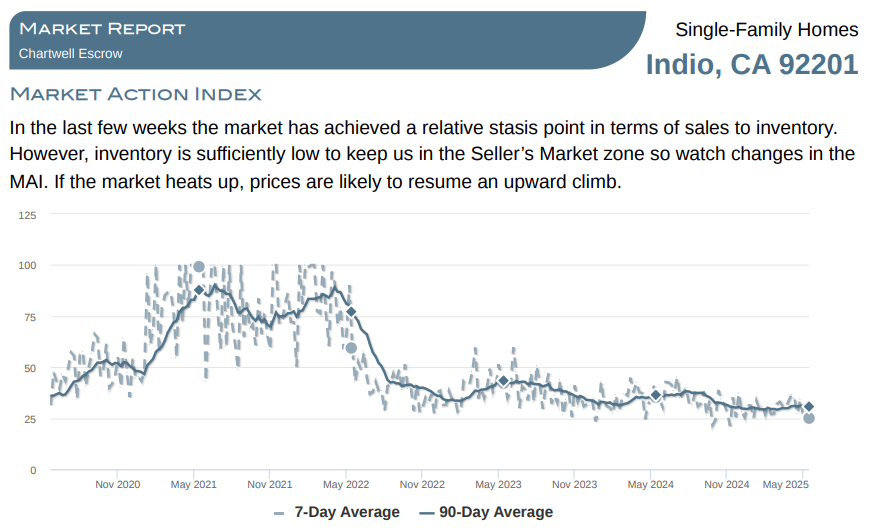
In the last few weeks the market has achieved a relative stasis point in terms of sales to inventory. However, inventory is sufficiently low to keep us in the Seller’s Market zone so watch changes in the MAI. If the market heats up, prices are likely to resume an upward climb.
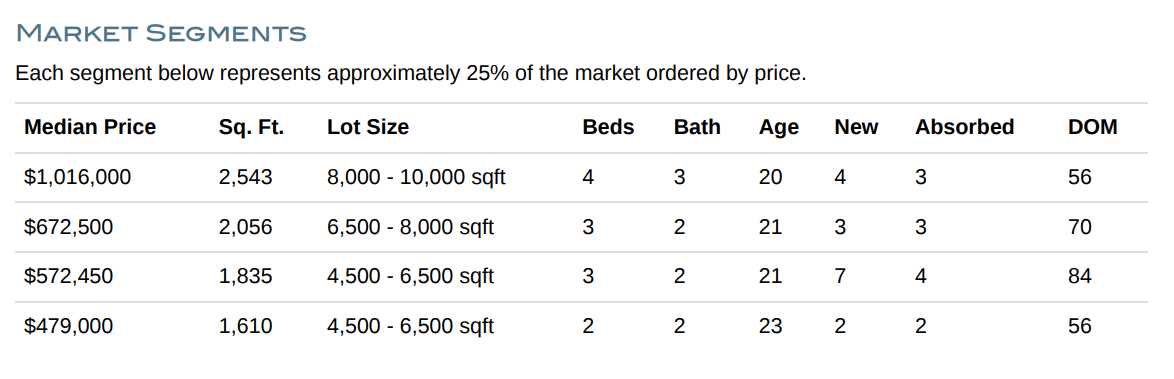
Indio market segments table comparing prices, home and lot sizes, beds, baths, and market activity across four segments.

Chart of median list prices for single-family homes in Indio, California 92201, through May 2025.

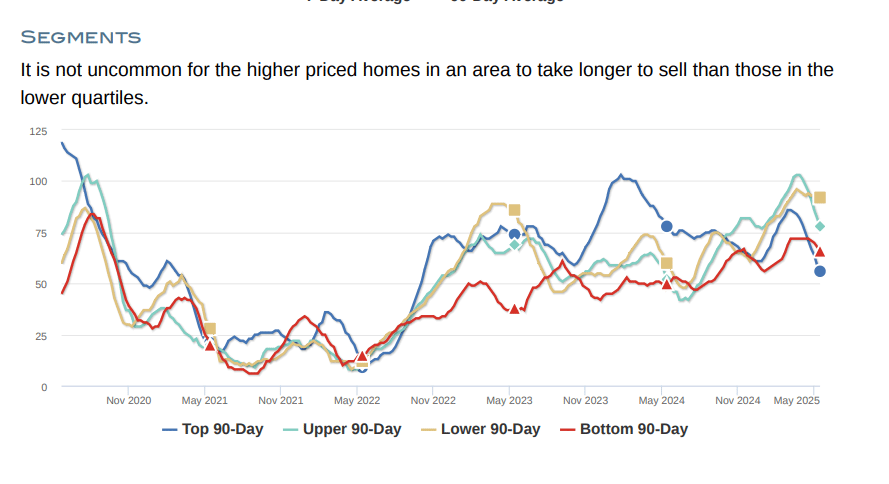
Segments


In the quartile market segments, we see prices in this zip code generally settled at a plateau, although Quartile 1 is on a bit of an up trend in recent weeks. We'll need to see a persistent shift in the Market Action Index before we see prices across the board move from these levels.
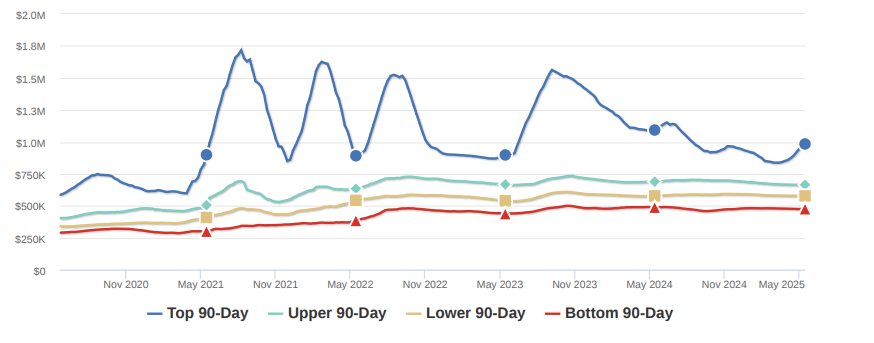
Line chart of four 90-day price ranges from November 2020 to May 2025, with the top range fluctuating most.

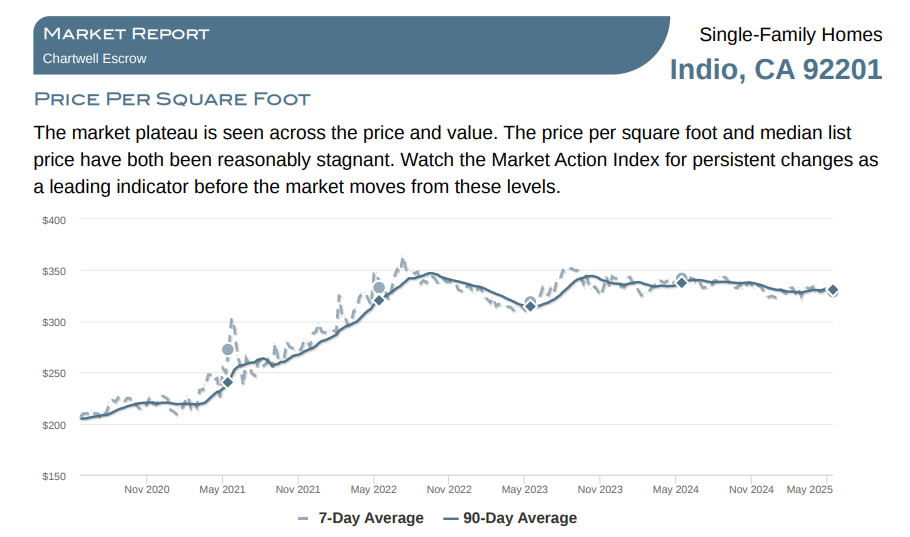
Indio price-per-square-foot chart: 7-day and 90-day averages rise from 2020, then level near $330 by May 2025.

Inventory chart comparing 7-day and 90-day averages from 2020 to May 2025.

Indio single-family home market action index chart comparing 7-day and 90-day averages through May 2025.

Line chart of four Indio market segments from November 2020 to May 2025, with all ending near 40.

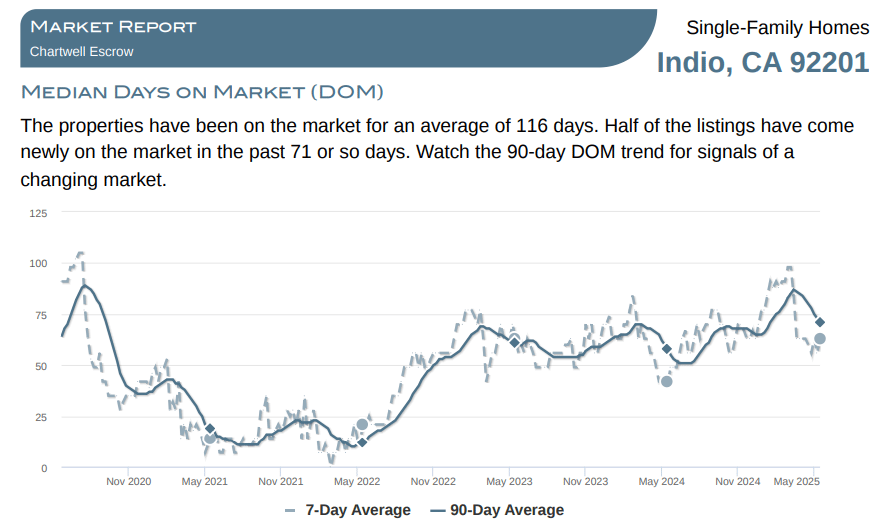
Indio single-family home days-on-market chart with 7-day and 90-day averages through May 2025.

Line chart comparing four 90-day market segments from November 2020 to May 2025.


Work With Kim

She has become an expert in helping sellers transform their homes to achieve the highest possible value. Contact her today!

Follow Me on Instagram