Indio, CA 92201
Thu May 15 2025
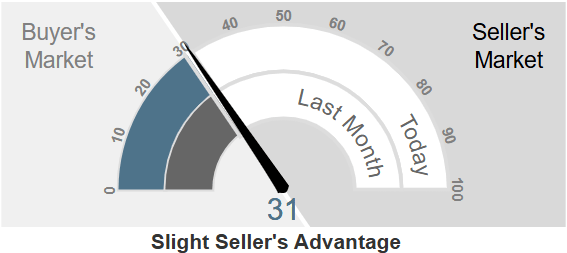
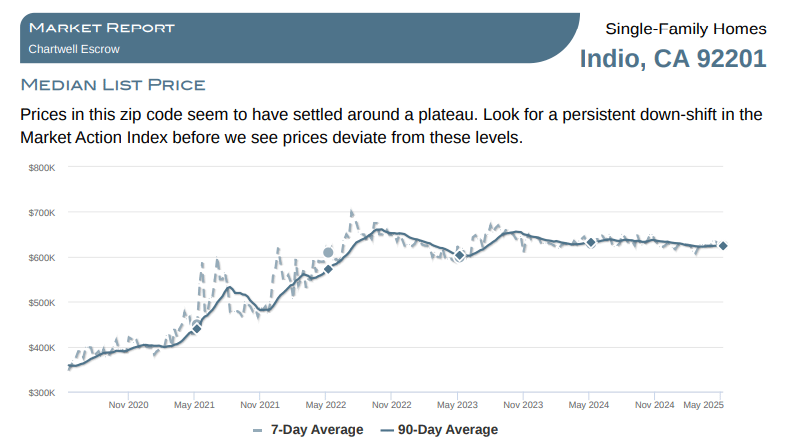
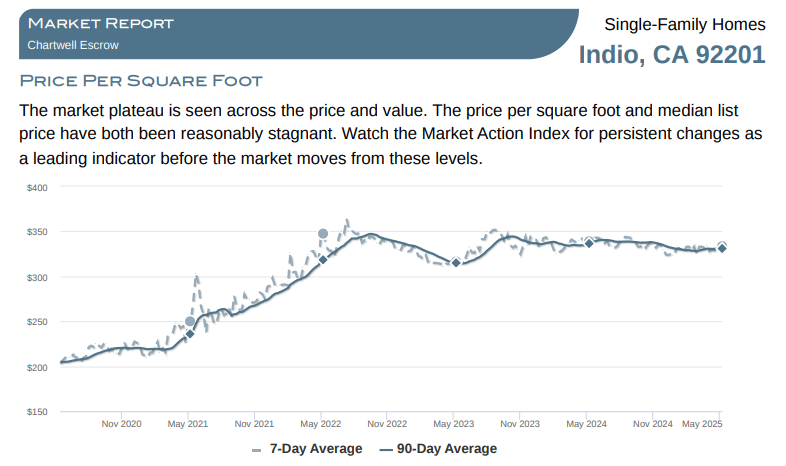
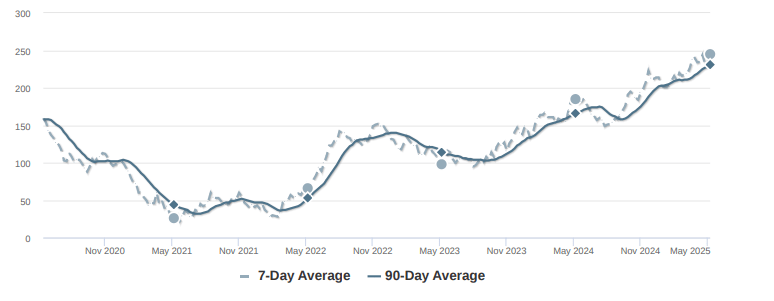
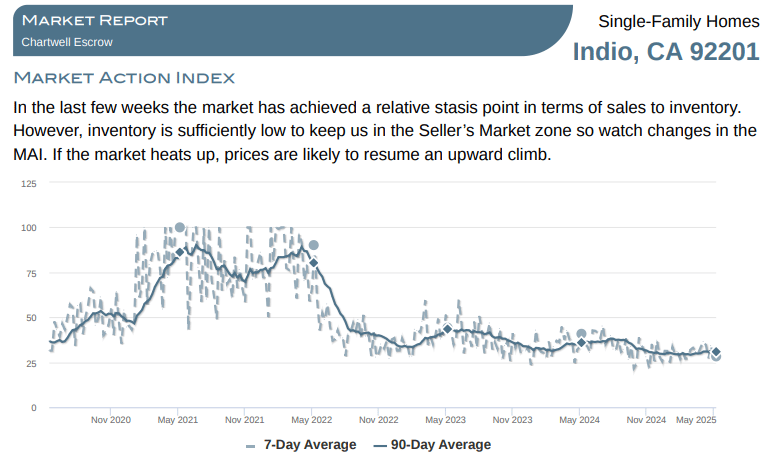
This week the median list price for Indio, CA 92201 is $625,000 with the market action index hovering around 31. This is about the same as last month's market action index of 31. Inventory has increased to 245.
Market Action Index
This answers “How’s the Market?” by comparing rate of sales versus inventory.
Market Narrative
In the last few weeks the market has achieved a relative stasis point in terms of sales to inventory. However, inventory is sufficiently low to keep us in the Seller’s Market zone so watch changes in the MAI. If the market heats up, prices are likely to resume an upward climb.
Segments
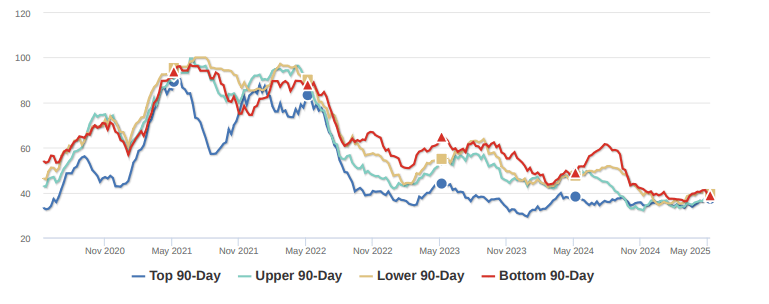
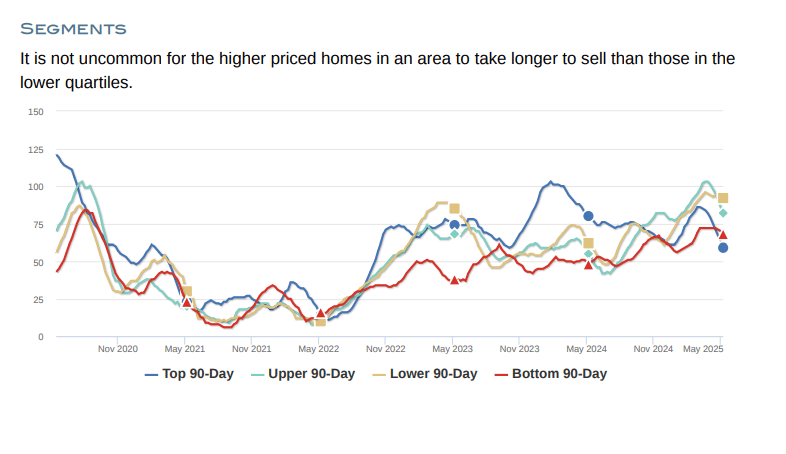
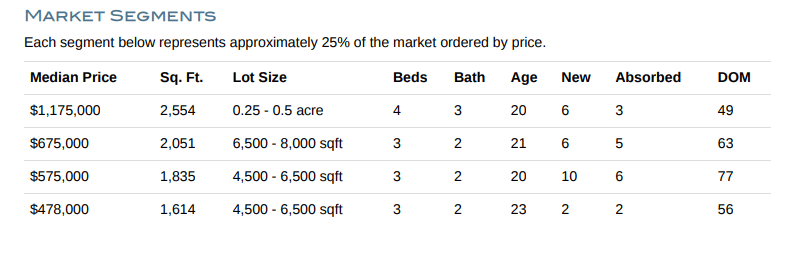
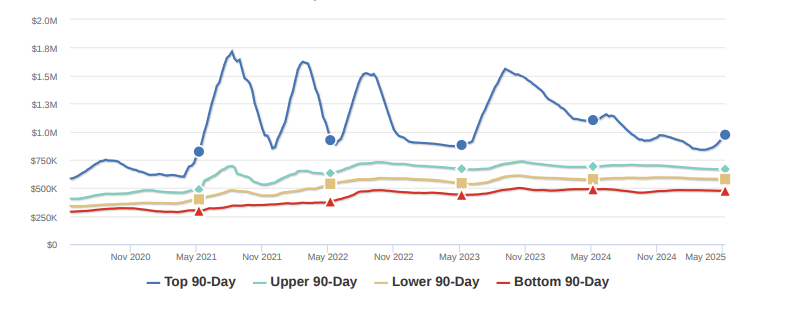
In the quartile market segments, we see prices in this zip code generally settled at a plateau, although Quartile 1 is on a bit of an up trend in recent weeks. We'll need to see a persistent shift in the Market Action Index before we see prices across the board move from these levels.
Inventory
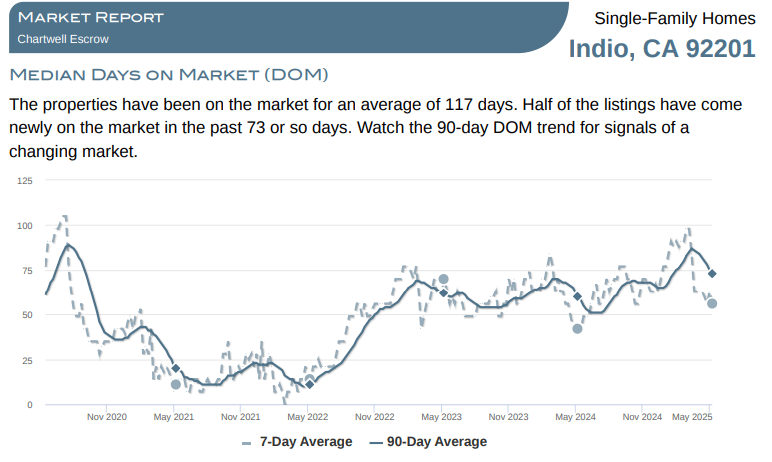
Inventory has been climbing lately. Note that rising inventory alone does not signal a weakening market. Look to the Market Action Index and Days on Market trends to gauge whether buyer interest is keeping up with available supply.
Market Action Segments
Not surprisingly, all segments in this zip code are showing high levels of demand. Watch the quartiles for changes before the whole market changes. Often one end of the market (e.g. the highend) will weaken before the rest of the market and signal a slowdown for the whole group.